|
MometerMometer
Because trends are composed
of a series of price pullbacks and
retracements, momentum plays
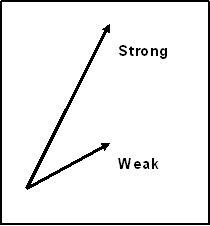
a key role is assessing trend strength
and potential weakness. As such, it is important to know when a
trend is likely to be becoming exhausted. Strong momentum does not
always lead to exhaustion and a reversal,
but it does signal that something will most likely be changing
soon, and that the trend may consolidate or retrace. After all,
trends must stop at some point and retrace or pullback. All trends
do it, and they always will.
For our purposes, we are simply looking for an indication that price is showing strong momentum according to an underlying set of data. It is not important to watch this data in order to determine if this condition does or does not exist. We simply need to keep our eyes on our charts and only the necessary information will be used to alert us to the fact that the condition exists. Therefore the need for multiple charts, monitors, computers, and indicators is greatly diminished.
Mometer Description
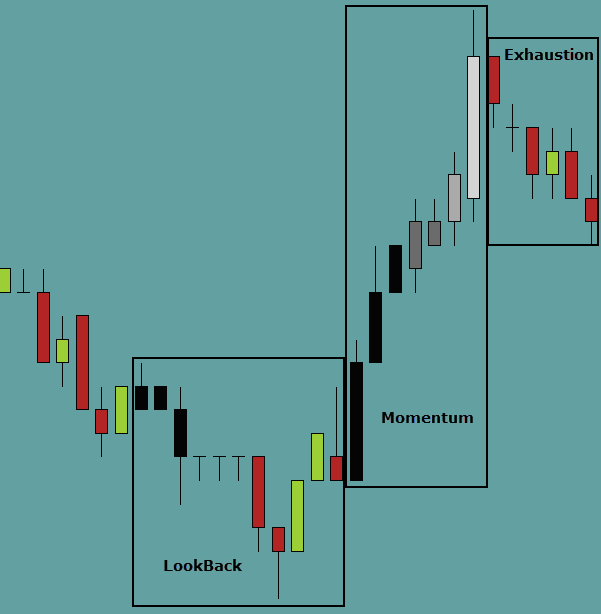
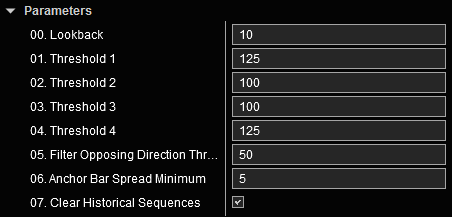
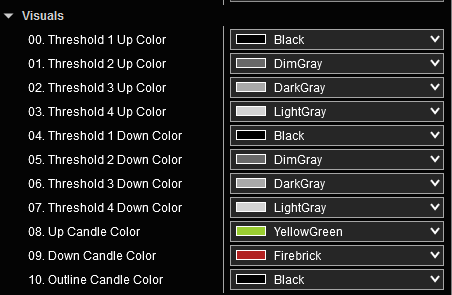
The Mometer indicator allows for the user to define threshold levels for acceptable momentum signals. The indicator reads the bar sizes (Hi to low, in ticks/pips) of each of the bars in the number of bars in the lookback period and averages them. The current bar is then compared to this average and if it exceeds this average by a user definable percentage, this bar becomes a potential anchor bar to begin a series of bars that could indicate increasing momentum. Each subsequent bar is then measured relative to the previous bar to determine if that bar is showing steady or increasing momentum.
There are times in a momentum series when a small body bar in the opposite direction of the momentum is displayed. If the user would like to filter these small bodied bars, a parameter setting is available for the size body to filter by percentage of the previous bar size. This will remove the bar from consideration in the momentum series and the series will continue until a larger bar in the opposite direction that exceeds the filter is displayed. This opposite direction bar will signal the end of the current momentum series. However, depending on the parameter settings, this bar could also be the beginning of a new momentum series in the opposite direction.
The first bar of a momentum series will not necessarily be the first bar in that direction of the series. In fact, it is common for momentum to increase more slowly and build. Momentum may only be evident after several bars in a particular direction. When this is the case, the Mometer indicator will back paint all of the bars that preceded the anchor bar but were in the proper direction. This is done simply to help the user identify that these slow momentum bars where part of the series even though it was not evident until later. This gives the user a better sense of the actual momentum and better information for making quick decisions. Figure 1 |