

|
MacDiverMacDiver for NinjaTrader Divergence: When the
price of an instrument and an indicator, index
or other related instrument move in opposite
directions. In technical analysis, traders make transaction
decisions by identifying situations of divergence, where the
price of a stock and a set of relevant indicators, such as the MACD
Momentum Oscillator, are moving in opposite
directions.
|
|
|
|
Figure 1: Momentum |
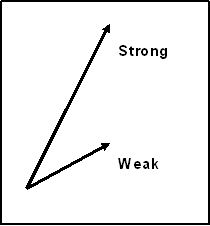
For example, the length of the upswings in an
uptrend can be measured. Longer upswings suggest that the uptrend
is showing increased momentum, or getting stronger. Shorter
upswings signify weakening momentum and trend strength. Equal
length upswings means the momentum remains the same. (For related
reading, see Momentum
Trading With Discipline and Riding
The Momentum Investing Wave.)
Price swings are not
always easy to
evaluate with the naked eye - price can be choppy. Momentum
indicators are commonly used to smooth out the price action and
give a clearer picture. They allow the trader to compare the
indicator swings to price swings, rather than having to compare
price to price.
Momentum Indicators
Common momentum indicators for measuring price
movements include the MACD, relative strength
index (RSI), stochastics and rate of
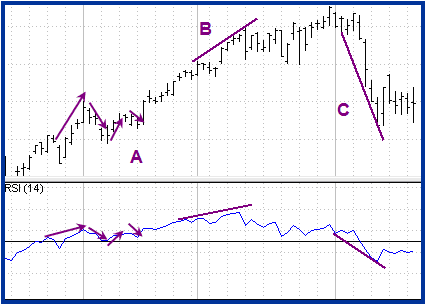
change (ROC). Figure 2 is an example
of how RSI is used to measure momentum. The default setting for RSI
is 14. RSI has fixed boundaries with values ranging
from 0-100.
For each upswing in price, there is a similar
upswing in RSI. When price swings down, RSI also swings
down.
|
|
|
Figure 2: Indicator swings generally follow the direction of price swings (A). Trendlines can be drawn on swing highs (B) and lows (C) to compare the momentum between price and the indicator. |
|
Source: TDAmeritrade Strategy Desk |
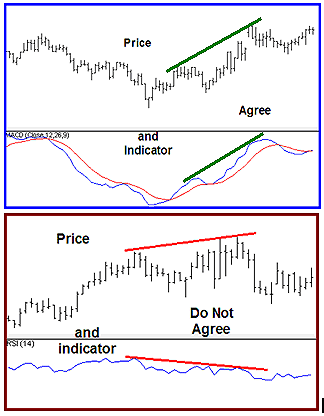
The study of momentum simply checks
whether price and the indicator agree or disagree.
|
|
|
Figure 3: Compare price and indicator to make better trading decisions. |
|
Source: TDAmeritrade Strategy Desk |
Momentum Divergence
Disagreement between the indicator and price
is called divergence and
it can have significant implications for trade management. The
amount of agreement/disagreement is relative, so there can be
several different patterns that develop in the relationship between
price and the indicator. For this article, the discussion will be
limited to the basic forms of divergence.
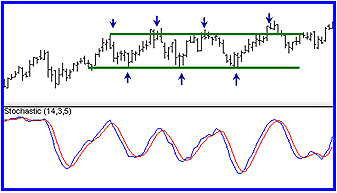
It is important to note that there must be
price swings of sufficient strength to make momentum analysis
valid. Therefore, momentum is useful in
active trends,
but it is not useful in range conditions in which price swings are
limited and variable, as shown in Figure 4.
|
|
|
Figure 4: In range conditions the indicator does not add to what we see from price alone. Variable pivot highs and lows show range. |
|
Source: TDAmeritrade Strategy Desk |
Divergence in an uptrend occurs when price
makes a higher high, but the indicator does not make a higher high.
In a downtrend, divergence occurs when price makes a lower low, but
the indicator does not make a lower low. When divergence is
spotted, there is a higher probability of a
price retracement.
Figure 5 is an example of divergence and not a reversal, but a
change of trend direction to sideways.
|
|
|
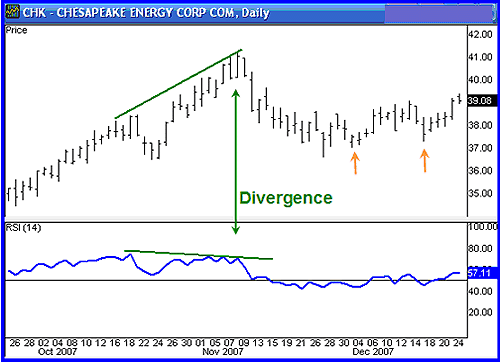
Figure 5: Momentum divergence and a pullback. Higher pivot highs (small orange arrows) signal price support. |
|
Source: TDAmeritrade Strategy Desk |
Divergence helps the trader recognize and
react appropriately to a change in price action. It tells us
something is changing and that the trader must make a decision
about the trade, such as tighten the stop-loss or
take profit. Seeing divergence increases profitability by
alerting the trader to protect profits.
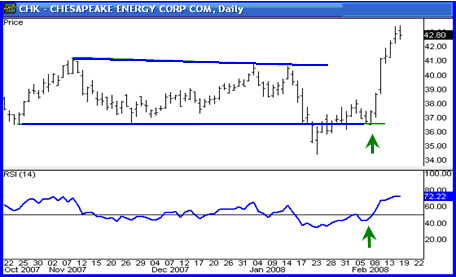
Take note of the stock from Figure 5,
Chesapeake Energy Corp. (NYSE:CHK), in which shares pulled back to the support. The chart
of CHK in Figure 6 (below) shows that trends do not reverse quickly
or often. Therefore, we make the best profits when we understand
trend momentum and use it for the right strategy at the right
time.
|
|
|
Figure 6: Trend continuation. Agreement between price and the indicator give an entry (small green arrows). |
|
Source: TDAmeritrade Strategy Desk |
Managing Divergence
Divergence is important for trade management.
In Figure 5, taking profit or selling
a call option were fine strategies. The divergence between the
price and the indicator lead to a pullback and then the trend
continued. If you look at the pivot the price makes below the
lower trendline, this is often referred to as
a bear trap, where the false signal draws in shorts and
then price quickly reverses. We can see that the signal to enter
appeared when the higher low in price agreed with the higher low of
the indicator in Figure 6 (small green arrows).
Divergence indicates that something is
changing, but it does not mean the trend will reverse. It signals
that the trader must consider strategy options: holding, selling
a covered
call, tightening the stop, or taking
partial profits. The glamour of wanting to pick the top or
bottom is more about ego than profits. To be consistently
profitable is to pick the right strategy for what price is doing,
not what we think price will do.
|
|
|
Figure 7: Divergence results in range. |
|
Source: TDAmeritrade Strategy Desk |
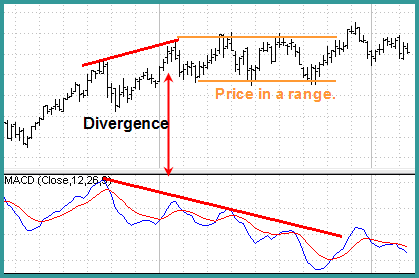
Figure 7 shows divergence that leads to
sideways price action. Notice the weakening momentum
in moving average convergence
divergence (MACD) as price enters
a range. This signals that the trader should consider strategy
options. When price and the indicator are inconsistent
relative to each other, we have disagreement, or divergence. We are
not in control of what price will do; we control only our own
actions.
|
|
|
Figure 8: Divergence and then reversal of trend. |
|
Source: TDAmeritrade Strategy Desk |
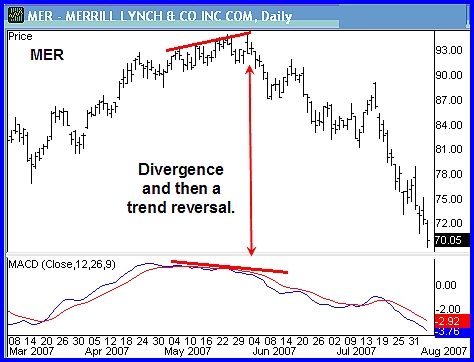
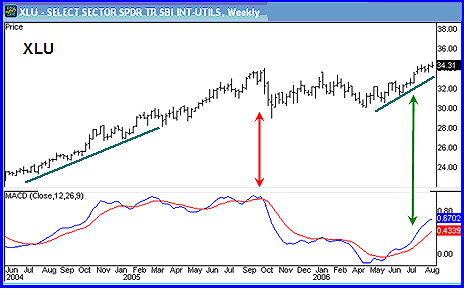
Sometimes divergence will lead to a trend
reversal, as shown in Figure 8. The Utilities Select Sector ETF
(AMEX:XLU) shown in Figure 9 pays a dividend and has options.
Understanding trend momentum gives a profit edge as there are three
ways to profit here: capital gains, dividends and call premium.
This example shows trend continuation after a sideways move, which
translates into profit continuation.
|
|
|
Figure 9: Go with the trend when the price and the indicator agree. |
|
Source: TDAmeritrade Strategy Desk |
Conclusion
The most useful way to use a momentum
indicator is to know what strategy to use. Price
will lead the way but momentum can indicate a
time to preserve profits. The skill of a professional trader lies
in his or her ability to implement the correct strategy for price
action. Article
by Candy
Schaap
HUD (Heads Up Display)
With all of our Intentional Indicators our attempt is to remove all extraneous information, and to put the information that we really need for making trade decisions right in front of us on our charts. This is the “HUD†or “Heads Up Display†approach we take with each of our indicators. This approach to developing our indicators creates much cleaner, neater charts and keeps the trader from having to look away from his or her target in order to make a good trade decision. It simplifies every trade decision so that they can be made quickly and accurately.
For our purposes, we are simply looking for an indication that price is showing a potential reversal according to an underlying set of data. It is not important to watch this data in order to determine if a condition does or does not exist. We simply need to keep our eyes on our charts and only the necessary information will be used to alert us to the fact that a condition exists. Therefore the need for multiple charts, monitors, computers, and indicators is greatly diminished.
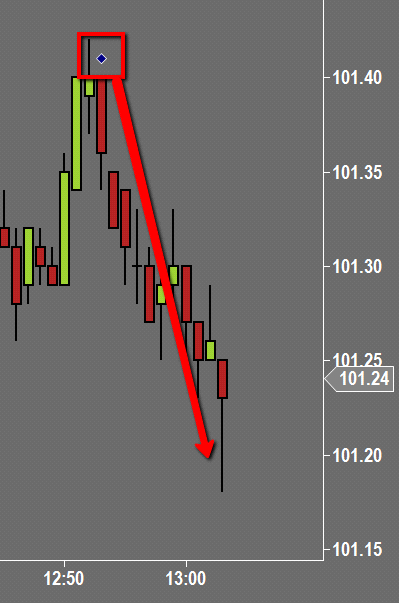
The MacDiver indicator will generate a draw or text object on a chart to indicate when divergence is present. This object will print on the open of the current bar (CalculateOnBarClose=False) only if the parameters that have been set to indicate divergence, and will print either above or below the bar. If it prints above the bar, then a reversal or pullback sell (short) could be anticipated. If it prints below the bar, then a reversal or pullback buy (long) could be anticipated..
Parameter Settings
MacDiver has a number of parameter settings to give the trader the ability to adjust or tune the indicator to whatever instrument, chart, or time frame that he or she desires.
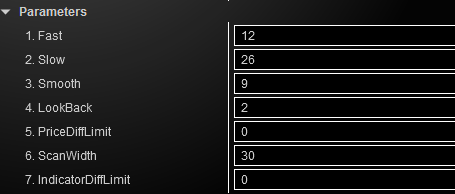
Fast Period
The fast moving average period used to compute the MACD line
Slow Period
The slow moving average period used to compute the MACD line
Smooth
The smoothing period used to smooth the resulting values.
LookBack
The number of bars to look back and measure when to determine divergence.
PriceDiffLimit
The difference in price the bar must be when being compared with others to determine divergence.
ScanWidth
How far back to look for High or Low value of a bar
IndicatorDiffLimit
The difference in price that bar must be when comparing for divergence
Calculate
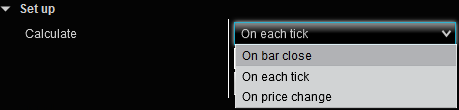
Determines when the calculations take place. On each tick is going to be more CPU intensive but will give more accurate information from which to make decisions.
Draw Bar Object Settings
The user has the ability to use any NinjaTrader drawing object such as dots, arrows, or triangles as well as using any text to customize how the indicator appears on the chart.
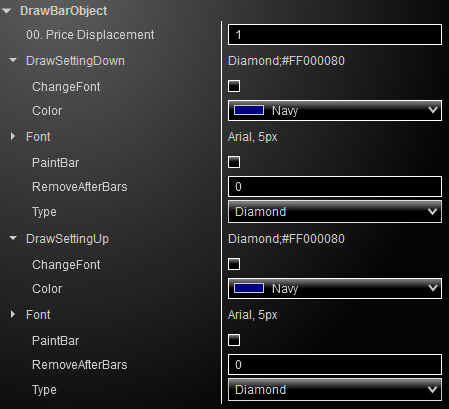
Click the “>†sign next to DrawSettingUp to set the parameters of the drawing object that prints on the chart to indicate a positive divergence condition.
This will open up some selections where you can choose the parameters of the look and actions of the draw object.
Color
Choose from any of the NinjaTrader default color selections
Font (see below, Using
Fonts)
PaintBar
If you do not want to print a
draw object on your chart, you can choose to have the entire bar or
candlestick paint a color to indicate that a positive condition
exists. Selecting this checkbox will override any other
settings.
RemoveAfterBars
Number of bars after the bar on which the draw object printed that the draw object will be removed from the chart.
Type
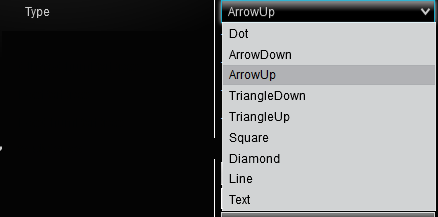
Using Fonts
Select the draw object or “Textâ€.
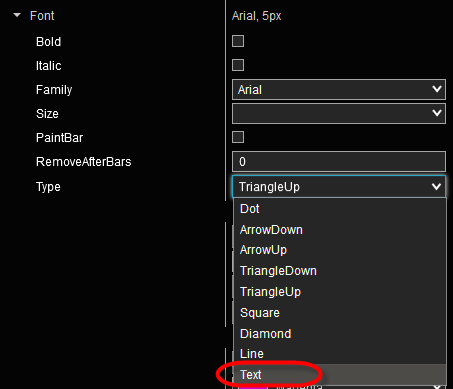
Steps required to change to a custom printed character:
For illustration, let’s say the user prefers a star rather than an arrow or other draw object. How do we display a star on the chart? Follow the steps below:
- To change to a new custom symbol, select “Text†in the MacDiver indicator settings under DrawBarObject.
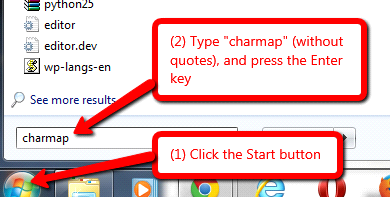
- To view and choose a character set, click on the Windows Start button. Type charmap and press Enter.
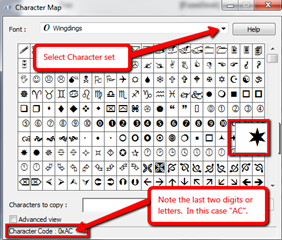
- This last step will bring up all the character sets available on the local computer. Browse through the options such as Webdings, Wingdings, or other graphical or text characters.
- For example, let’s say the user wants a star from the Wingdings set. Make a note of two pieces of information: (1) that it is in the Wingdings set; and (2) that the character code ends in “ACâ€.
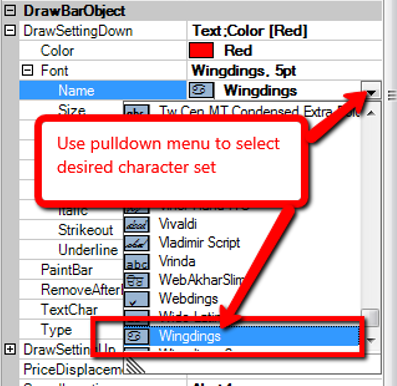
- Next, go back to the PullBack Alert indicator settings in NinjaTrader. Under Font Name, use the pulldown menu to select the character set from Step 4. For our example, we select “Wingdings.â€
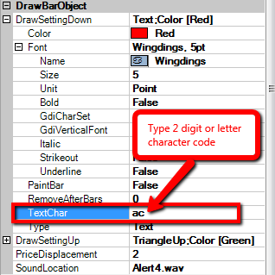
- From Step 4 above, type in the two digit or letter character code for the particular character that was chosen from the character set. This is entered in the MacDiver indicator settings under the TextChar settings as shown to the right.
In this example, we would type ac (not case sensitive) in the TextChar box in order to get the Wingdings star.
From here, the user can select the size and color of the chosen symbol.