Ricochet Indicator
Like many of our indicators, the Ricochet indicator is also one of our HUD or “Heads Up Display” indicators.
HUD (Heads Up Display)
With all of our Intentional Indicators our attempt is to remove all extraneous information, and to put the information that we really need for making trade decisions right in front of us on our charts. This is the “HUD” or “Heads Up Display” approach we take with each of our indicators. This approach to developing our indicators creates much cleaner, neater charts and keeps the trader from having to look away from his or her target in order to make a good trade decision. It simplifies every trade decision so that they can be made quickly and accurately.
For our purposes, we are simply looking for an indication that price is showing a potential reversal according to an underlying set of data. It is not important to watch this data in order to determine if a condition does or does not exist. We simply need to keep our eyes on our charts and only the necessary information will be used to alert us to the fact that a condition exists. Therefore the need for multiple charts, monitors, computers, and indicators is greatly diminished.
Ricochet
Like our SpeedTick indicator, the Ricochet indicator takes data from an underlying tick chart that is specifically measuring time and sales activity, and applies it to any chart that the trader requires (you will not need to open a tick chart, simply provide the parameters for it in the indicator settings and Ricochet will do the rest). Ricochet will need to be “tuned” for each instrument, time frame, and chart type that a trader might want to use. The parameter settings for the Ricochet are often, and most reliably, calculated using the RicochetLevel indicator that ships with the Ricochet indicator. These calculations will be used to tune Ricochet and usually only needs to be done occasionally for each chart type, series, and/or instrument. Once the settings are producing the desired results, you can save these settings along with other indicators settings in the Save Analysis Group settings.
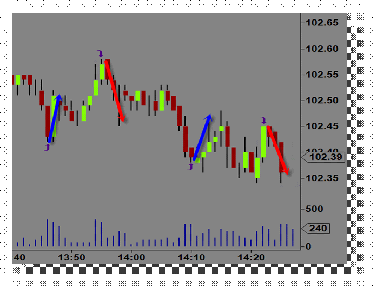
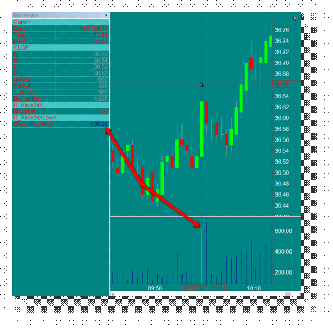
Figure 1: shows the Ricochet indicator applied to a 1 minute chart with the RicochetLevel tool in the panel below it. Tuning the Ricochet indicator requires some trial and error testing in order to find the best settings for your preferred combination of instrument, data series, and chart type.
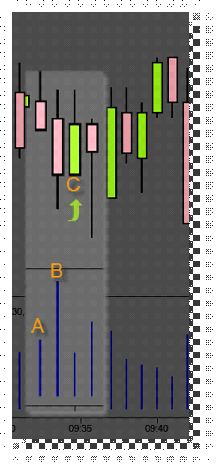
For this example we are looking for a bar on the RicochetLevel histogram that is 100% or more greater than the previous bar. This will indicate to us that a large number of orders was just processed and that we might expect a pullback in price immediately following.
Each bar in the RicochetLevel histogram is constantly being measured and compared to the other bars in the histogram. When bar B exceeds bar A by a user selected percentage, then a draw object will appear at the user selectable location, C, on the chart. In this example the location selected is one bar on the minute chart to the right of the close of the bar from the selected tick chart on which the ricochet indicator is based.
“Tuning” Ricochet for an instrument
Apply Ricochet and RicochetLevel to a chart.
Go back to a time period on the chart that is typically an active trading period for your particular trading system or style.
Visually notice the highs and lows of a price trend on which you would like to generate a draw object on the chart.
Scan the RicochetLevel tool at that point to see if the current histogram bar is higher than the previous bar by the percentage amount set in the “Percent” parameter.
To verify, open a data window to show you the actual values of each histogram bar as you move your mouse over them.
Do this over several days or weeks of historical charts to tune the parameters to generate the best signals at each point in which you desire a draw object.
Note: There is no perfect setting. The more draw objects you require at the highs and lows of a historical chart, the more you will get inside a trend. There will be a percentage of draw objects that give appear to give false signals relative to positive signals. This in fact is not the case. The indicator is simply signaling that a condition exists. This is typical of any indicator and is only to be used as a tool to help determine a potential pullback. Do not use this or any other single indicator as an entry or exit signal. This indicator is a tool to help the trader read the current conditions only. It is up to the trader to use his or her own discretion when making trade entry or exit decisions.
Parameter Settings
Ricochet has a number of parameter settings to give the trader the ability to adjust or tune the indicator to whatever instrument, chart, or time frame that he or she desires.
TickValue
The tick chart from which the data is collected. Typically this is a very fast chart relative to the chart on which it is being applied. For a 1 minute chart a value less than 50 is a good place to start. The faster the tick chart the better the result, but also the slower it is able to calculate the amount of data coming in. On high volume instruments the TickValue may be increased to allow for quicker processing. On low volume instruments lower tick value is best.
Period
This is the lookback period in seconds that the data is collected.
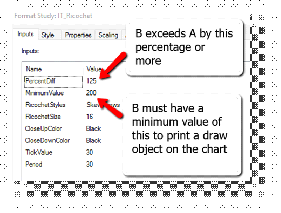
PercentDiff
The percentage of increased activity over the previous bar activity.
Minimum Value
The current bar must reach a minimum activity level of this amount in order to generate a draw object on the screen.