Tuning the SpeedTick for Forex
For a general discussion of the settings and what the SpeedTick indicator measures, please see the previous topic. In this section we want to give the user a starting point for forex settings and some guidelines for adjusting the parameters. We encourage the user to become fully acquainted with the software by exploring the various settings. There are no absolute or perfect settings; however, the user will soon zero in on his or her preferences.
Starting Point Settings:
We have studied the following pairs on 1 minute, 5 minute and 15 minute charts: EUR/USD, USD/JPY, GBP/USD, and AUD/USD. The following settings are a good starting point for these pairs and the time-based charts that we looked at:
As we study a variety of other chart types, we will post updates here; however, it is ultimately up to each user to adjust the settings based on his or her own preferences and needs.
Guidelines for Adjusting the Adaptive SpeedTick Settings:
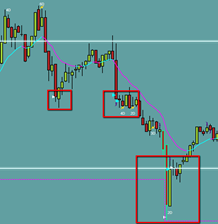
The goal when tuning the SpeedTick is to pinpoint key areas of increased activity of actual orders going through (see <SpeedTick and SpeedTickLevel> documentation). This lets us know that a possible manipulation by market movers is underway with a likely “pullback” from this quick move to immediately follow. We capitalize on these pullbacks from these quick and unexpected moves.
We do not trade every SpeedTick that appears, rather we want to be able to isolate the types of areas shown below for further qualification in our trade setups.
Step 1: Apply the indicator and leveling tool to the chart
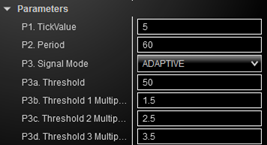
- Put both the IT_SpeedTick indicator and the IT_SpeedTickLevel tool on a chart.
- Make sure the Parameters (P1 through S2) are identical for both.
- Use the “Adaptive” setting in P3. This allows the indicator to adjust to market conditions automatically. This feature is essential for accurate SpeedTick signals in forex.
Step 2: Adjust TickValue and Period settings
- We want to see variation in the height of the histogram bars otherwise we will either get either no SpeedTicks or too many spurious SpeedTicks.
- We can achieve more differentiation in histogram bar height by lowering the TickValue (P1) and/or increasing the Period (P2).
- For example, on the left (below) we have increased the TickValue from 5 to 20 (see Starting Point Settings above) while holding the Period constant. This results in little differentiation of individual histogram bar heights. On the right, we have the Starting Point settings referenced above.
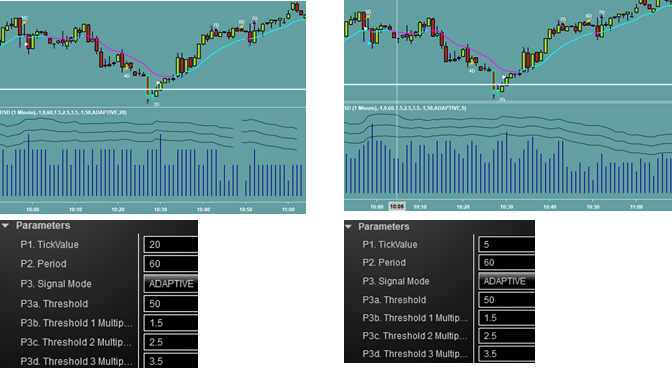
- Likewise, if we hold the TickValue (P1) constant and lower the Period (P2), we will also end up with little differentiation in the histogram which is undesirable. The user can verify this.
- Ideally, we want to balance the TickValue and Period so that we have clear differentiation of individual histogram bars.
- Lowering the TickValue (P1) too low may be more demanding on computer resources as a lower TickValue means that ticks are being evaluated more often.
- Therefore, the user needs to find the right balance of low TickValue and higher Period for their needs and resources.
Step 3: Initial values for the Threshold settings
- As discussed in the initial SpeedTick Documentation, SpeedTicks appear when a histogram bar crosses a certain user-defined threshold. We have 3 threshold levels corresponding to the 3 levels of SpeedTicks (lower activity, medium activity, and higher activity).
- In the case of the Adaptive setting of the SpeedTick, we start with an initial value of Threshold (P3a), however the actual threshold, and the 3 derived threshold levels (the 3 wavy lines above the histogram), will be updated by a type of “moving average” calculation based on the heights of the histogram bars. This gives it the adaptive quality.
- In addition, the user can set the Threshold Multipliers (P3b – P3d) that multiply the value in (P3a) for the 3 different levels of SpeedTicks (see Step 4 below).
- For example, if Threshold 1 Multiplier = 1, and the Threshold in P3a is set to 50, then the lowest level SpeedTick (white) will be triggered when a histogram bar crosses above 50 (but does not cross the two higher levels).
- Finding a good starting value for the Threshold is critical so that the 3 threshold multiplier lines can start to update and capture key peaks.
- For example, if we lower the Threshold from 50 (used in our Starting Settings above) to 20, the 3 multiplier levels would behave similarly to lowering a Moving Average (MA) period: the MA would start to trace the individual price bars. In this case, the multiplier lines would hug along the histogram. This is not necessarily a bad thing—it depends on user preference.
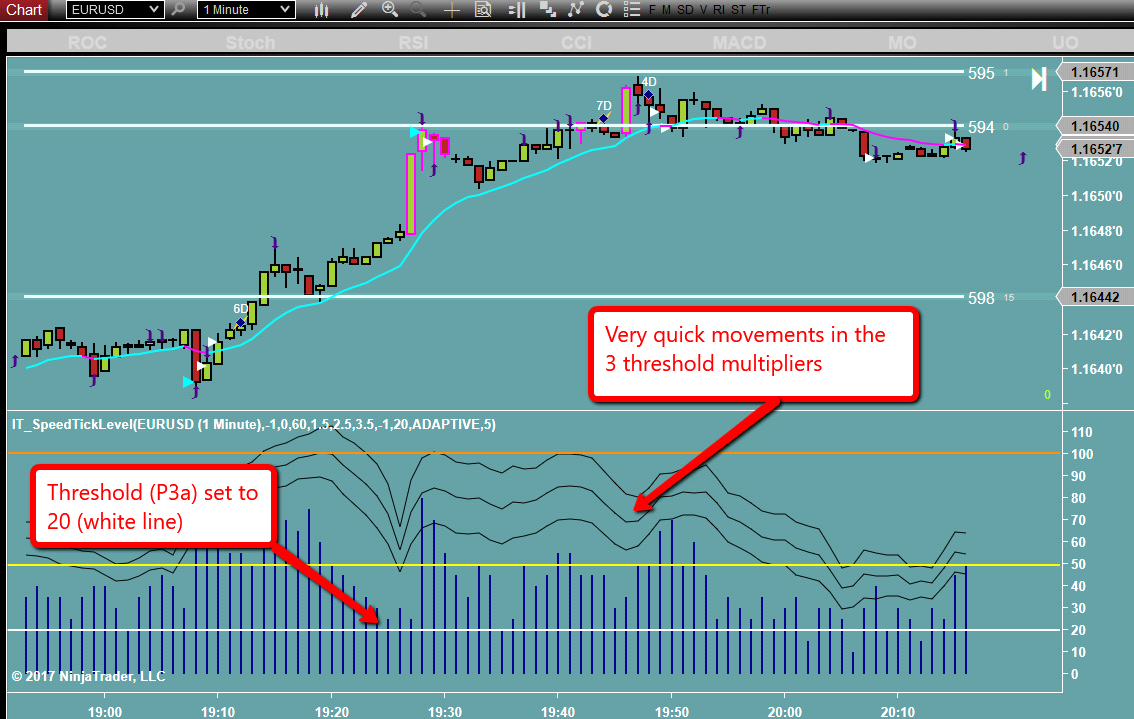
- On the other hand, if we increase the base Threshold well above most of the histogram peaks, say from 50 to 120, our 3 threshold levels would flatten out and be far from the histogram possibly causing us to miss some good SpeedTicks.
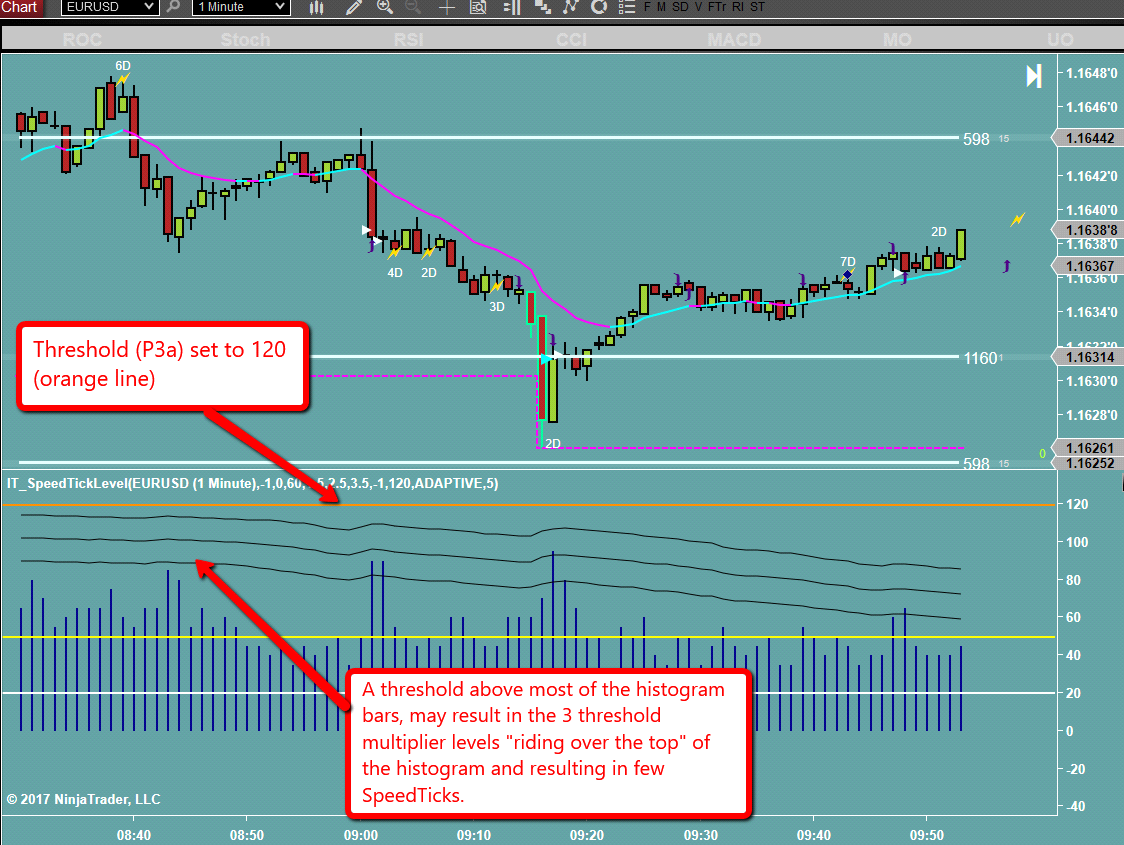
- Suggestion for a good base Threshold value: The user can scan the SpeedTick Leveler histograms for the main times he or she will be trading.
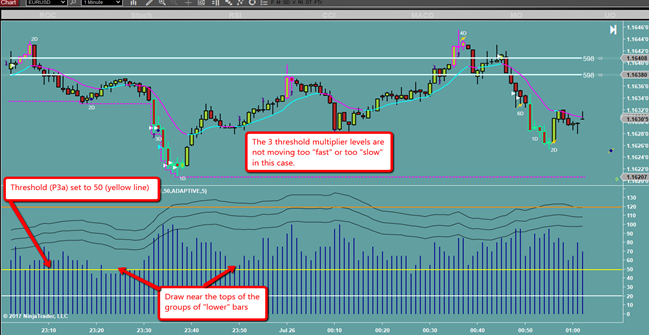
- Create some “toes”: the user will want to draw a horizontal line near the top of some of the lower bars. This will typically be a bit more than half way between zero and the higher bars. It is not necessary to be overly precise here as this is only the initial threshold setting; the actual threshold will be changing per market conditions as discussed above and in the initial SpeedTick Documentation.
Step 4: Set the 3 Threshold Multipliers
- The Threshold Multipliers adds an extra layer of power to the new SpeedTick by allowing users to further zero in on the best settings for their purposes.
- Try different settings such as 1, 2, 3 to start with. Try other multipliers and fractional settings as well (1.2, 2.5, 3.8, etc.).
- The user will quickly be able to see that in some cases, there are too many SpeedTicks versus too few. Due to our trade rules, we have ways of filtering trades so that we would ignore “non-strategic” SpeedTicks; however, strive to have only the most useful information on the charts, in other words, too many SpeedTicks on the chart is not as meaningful than a few quality ones.
- On the other hand, the user will want to choose Threshold Multiplier settings so as not to lose potentially useful SpeedTicks.
- Experiment and find the balance!
Other Chart Types and Forex Pairs:
Our purpose in these notes has been two-fold: (1) Give the user some strong SpeedTick starting settings for a variety of forex pairs and time-based charts; and (2) Give some guidelines so that the user can further tune the SpeedTick.
There is not a precise “recipe” for doing this; much of it is trial and error. It is up to individual users to become familiar with the indicator settings and experiment to determine the best settings for their trading. It is likely that very slow charts or non-time-based charts, such as tick charts, will need further tuning.