Velocity Indicator for NinjaTrader
Introduction
Velocity: The rate at which price moves over the course of a bar relative to a previous bar. Used to determine when price may be getting exhausted from a strong move and need to pause or pull back during a resting or consolidation period prior to making its next move.
HUD (Heads Up Display)
With all of our Intentional Indicators our attempt is to remove all extraneous information, and to put the information that we really need for making trade decisions right in front of us on our charts. This is the “HUD” or “Heads Up Display” approach we take with each of our indicators. This approach to developing our indicators creates much cleaner, neater charts and keeps the trader from having to look away from his or her target in order to make a good trade decision. It simplifies every trade decision so that they can be made quickly and accurately.
For our purposes, we are simply looking for an indication that price is showing a potential for exhaustion according to an underlying set of data. It is not important to watch this data in order to determine if a condition does or does not exist. We simply need to keep our eyes on our charts, and only the necessary information will be used to alert us to the fact that the condition exists. Therefore the need for multiple charts, monitors, computers, and indicators is greatly diminished.
The Velocity indicator will generate a zone or shadow object on a chart to indicate when the velocity of price changes more, and/or more quickly, than in previous (user definable) bars on the chart. This object will print on the current bar (CalculateOnBarClose=False) as soon as the velocity parameters have been met or exceeded. Or if preferred, it will print at the close of the current bar if CalculateOnBarClose=True.
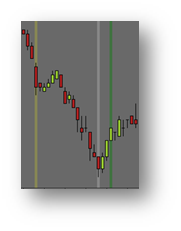
The Velocity indicator will generate a shadow behind the bar or candlestick that is showing a predetermined threshold to measure velocity. The shadow will appear on the current bar as soon as the velocity threshold is detected if CalculateOnBarClose is set to False. It is not uncommon for a velocity shadow to turn on and off or change colors during the course of the current bar. This happens when the threshold has been achieved, but then the velocity has begun to change (faster or slower) even before the close of the current bar.
Settings
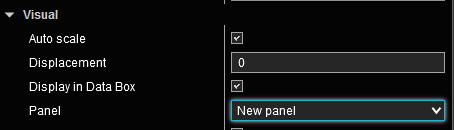
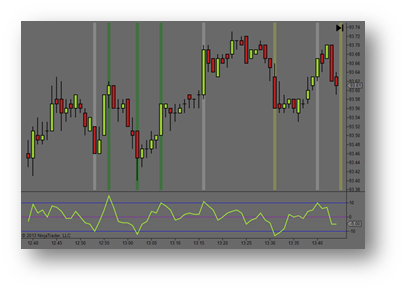
The Velocity indicator is collecting data from an underlying oscillator. To view this oscillator, set the “Panel” setting under “Visual” section to “New Panel”. During the normal course of trading, you may want this panel to be removed from your chart. To remove the oscillator, set the “Panel” setting to “Same as input series”.
The settings below are relative to the oscillator upon which the data is derived to produce the shadow images on the chart indicating thresholds of velocity.
Parameter Settings
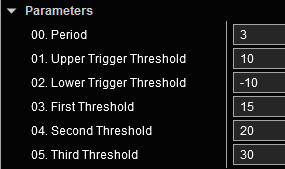
00 Period – The number of bars to use in the calculations for velocity.
01 First Threshold – The distance from the prior swing high/low that occurred on the opposite side of the Zero Line. When the oscillator reaches this threshold, it will trigger a shadow behind the current bar using the visual parameters in the next section.
02 Second Threshold – The distance from the prior swing high/low that occurred on the opposite side of the Zero Line. When the oscillator reaches this threshold, it will trigger a shadow behind the current bar using the visual parameters in the next section.
03 Third Threshold – The distance from the prior swing high/low that occurred on the opposite side of the Zero Line. When the oscillator reaches this threshold, it will trigger a shadow behind the current bar using the visual parameters in the next section.
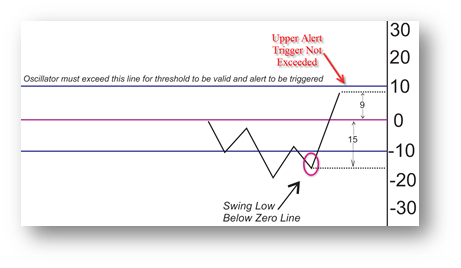
To generate an alert signal, the oscillator must travel the distance indicated by the Threshold parameters AND exceed an Alert Trigger Line. Additionally, the oscillator line’s most recent swing high or low must have originated on the opposite side of the zero line.
Visuals Parameters:
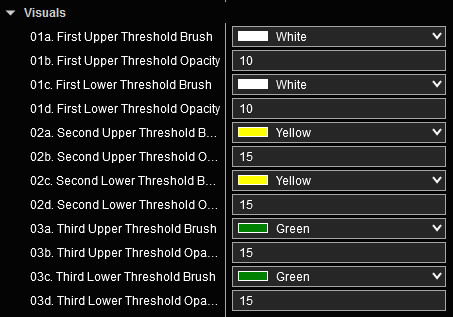
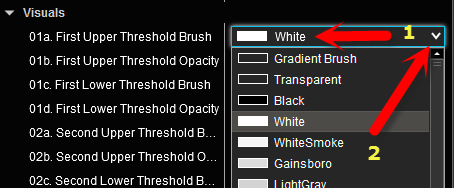
The color and opacity settings are user definable for each of the Upper and Lower threshold levels defined in the parameter settings above. These settings will be used for determining the how each threshold shadow is presented on the charts. To change a color, click on the color (1) and select the drop down arrow (2).
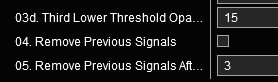 The user can leave the Velocity signals on their chart or have them removed after a user definable number of bars. To leave them on the chart, set the “Remove Previous Signals” to False. To remove them from the chart, set this setting to True. In the following setting, “Remove Previous Signals After X Bars”, the user can define how many bars after the current bar the indicator remains on the chart.
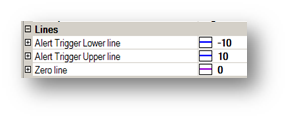
Alert Trigger Lines
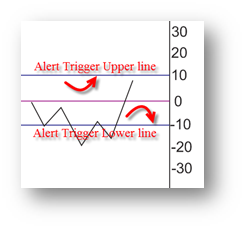 The Alert Trigger lines determine, after the threshold has been attained, if the move from the previous swing high or low qualifies as a signal. Price must meet or exceed this user definable line for the move to qualify to generate a signal. You might think of this as the “Must Exceed To Generate A Signal” line.
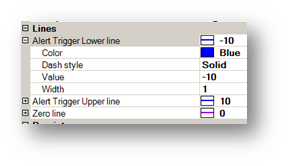
To change the position or the visual look of the line on the oscillator, click on the “+” sign on the left side of the label.
Alert Trigger line parameters are not related to the size of the movement of the oscillator from the previous swing high or low as indicated in the threshold settings. The scale on the right side of the oscillator panel is not related to threshold levels for anything other than measuring the size of the move from the previous swing high or low. Otherwise, the scale is only related to positioning of the Alert Trigger Lines.
Understanding How & When a Velocity Signal is Generated
The most efficient way to explain how and when a velocity signal is generated is to use some examples. We’ll begin with a set of parameters and when those parameters will generate a signal and why they will. We’ll follow up examples of when the same parameters will not generate a signal and why they will not.
Example Parameters:
Velocity Indicator Parameters
First Threshold 20
Second Threshold 25
Third Threshold 30
Alert Trigger Lower 10
Alert Trigger Upper 10
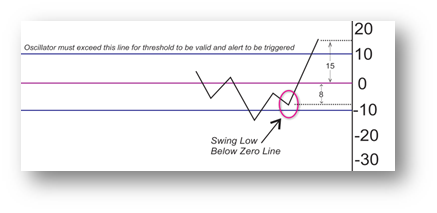 Qualified Signal Example 1: The most recent swing low is below the zero line at -8 on the scale. The oscillator line has exceeded the Upper Alert Trigger of 10, so it is now a candidate to trigger an alert if a threshold has been achieved. Notice that the oscillator line has reached 15 on the scale. If we count back for the swing low that occurred below the zero line and add 15 for the move that exceeds the zero line (8 + 15) we have a value of 23. Since the first velocity threshold is 20 and 20 has been exceeded, a signal will be generated using the parameters set for First Upper Threshold. As the movement increases and the oscillator continues to climb, it may reach the second or third threshold levels. At this point, the parameters will be used in the visual settings for the second threshold or third threshold to alert the user to the strength of the velocity movement.
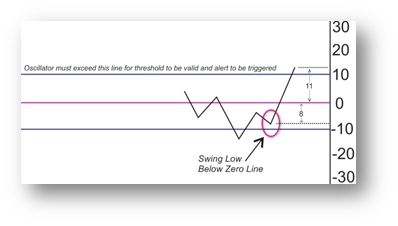
No Signal Example 1: The most recent swing low is below the zero line at -8 on the scale. The oscillator line has exceeded the Upper Alert Trigger of 10, so it is now a candidate to trigger an alert if a threshold has been achieved. However, the oscillator line has only reached 11 on the scale. If we count back for the swing low that occurred below the zero line and add 11 for the move that exceeds the zero line (8 + 11) we have a value of 19. Since the first velocity threshold is 20, no signal will be generated.
No Signal Example 2: The most recent swing low is below the zero line at -15 on the scale. The oscillator line has not exceeded the Upper Alert Trigger of 10 therefore no signal can be generated. The oscillator line has reached 9 on the scale. If we count back for the swing low that occurred below the zero line and add 11 for the move that exceeds the zero line (15 + 9) we have a value of 24. Although the first velocity threshold is set to signal at a threshold lower than that (20), no signal will be generated as the Upper Alert Trigger line has not been achieved.
Persistence
Each of our HUD indicators comes with the ability to save the parameters into separate templates for different applications. For example, if a trader chose to use the indicator on a 1 minutes CL chart and a 5 minute GC chart, the parameters are likely to have different settings to optimize the performance on each data series and instrument. NinjaTrader has the ability to save a template of the default setting for an indicator, but not to save the settings as applied to different instruments, data series, or chart types.
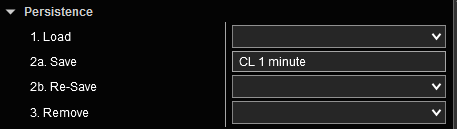
Persistence allows the trader to Load a template, Save a template, Resave a template, or Remove a template.
.
To save a template once the indicator parameters are set up as required, click inside the box labeled “Save…”. If this template has been saved before to a name that you would like to save it to again, click on the down arrow and select the name of the template you would like to over write with the new parameters. If you would like to create a new name, highlight the “Save…” and delete it. Type in a new template name for the saved indicator parameters.
The next time the indicator is added to a chart, the default indicator parameters will be automatically applied. To change these default parameters, use your persistence template by clicking on “Load” and then select the down arrow to open the drop down box with a list of available, previously saved, templates.
To remove a saved template click inside the remove box and select the drop down with the list of previously saved templates. Select the template you wish to remove. Be very careful to select the template to be removed as you will not get a message asking you if you are sure this is what you want to do. Any template selected will immediately be removed.
Note: There are no perfect settings for this indicator. The more draw objects you require at the highs and lows of a historical chart, the more you will get inside a trend. There will be a percentage of draw objects that give false signals relative to positive signals. This is typical of any indicator and is only to be used as a tool to help determine a potential pullback. Do not use this or any other single indicator as an entry or exit signal. This indicator is a tool to help the trader read the current conditions only. It is up to the trader to use his or her own discretion when making trade entry or exit decisions.