SuperD for NinjaTrader
Divergence: When the price of an instrument and an indicator, index or other related instrument move in opposite directions. In technical analysis, traders make transaction decisions by identifying situations of divergence, where the price of a stock and a set of relevant indicators, such as the relative strength index (RSI), are moving in opposite directions.
In technical analysis, divergence is considered either positive or negative, both of which are signals of major shifts in the direction of the price. Positive divergence occurs when the price of an instrument makes a new low while the indicator starts to climb upward. Negative divergence happens when the price of the security makes a new high, but the indicator fails to do the same and instead closes lower than the previous high.
Divergence: The Trade Most Profitable
Because trends are composed of a series of price swings, momentum plays a key role is assessing trend strength. As such, it is important to know when a trend is slowing down. Less momentum does not always lead to a reversal, but it does signal that something is changing, and that the trend may consolidate or reverse.
Price momentum refers to the direction and magnitude of price. Comparing price swings helps traders gain insight into price momentum. Here, we'll take a look at how to evaluate price momentum and show you what divergence in momentum can tell you about the direction of a trend.
Defining Price Momentum
The magnitude of price momentum is measured by the length of short-term price swings. The beginning and end of each swing is established by structural price pivots, which form swing highs and lows. Strong momentum is exhibited by a steep slope and a long price swing. Weak momentum is seen with a shallow slope and short price swing (Figure 1).
|
Figure 1: Momentum |
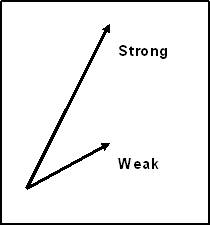
For example, the length of the upswings in an uptrend can be measured. Longer upswings suggest that the uptrend is showing increased momentum, or getting stronger. Shorter upswings signify weakening momentum and trend strength. Equal length upswings means the momentum remains the same. (For related reading, see Momentum Trading With Discipline and Riding The Momentum Investing Wave.)
Price swings are not always easy to evaluate with the naked eye - price can be choppy. Momentum indicators are commonly used to smooth out the price action and give a clearer picture. They allow the trader to compare the indicator swings to price swings, rather than having to compare price to price.
Momentum Indicators
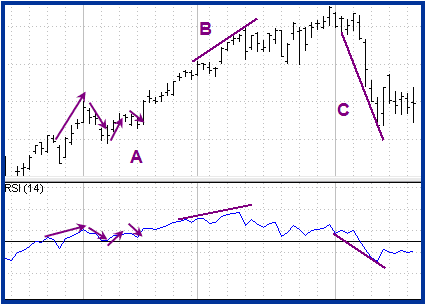
Common momentum indicators for measuring price movements include the relative strength index (RSI), stochastics and rate of change (ROC). Figure 2 is an example of how RSI is used to measure momentum. The default setting for RSI is 14. RSI has fixed boundaries with values ranging from 0-100.
For each upswing in price, there is a similar upswing in RSI. When price swings down, RSI also swings down.
|
Figure 2: Indicator swings generally follow the direction of price swings (A). Trendlines can be drawn on swing highs (B) and lows (C) to compare the momentum between price and the indicator. |
Source: TDAmeritrade Strategy Desk |
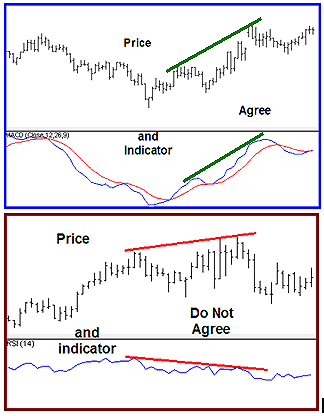
The study of momentum simply checks whether price and the indicator agree or disagree.
|
Figure 3: Compare price and indicator to make better trading decisions. |
Source: TDAmeritrade Strategy Desk |
Momentum Divergence
Disagreement between the indicator and price is called divergence and it can have significant implications for trade management. The amount of agreement/disagreement is relative, so there can be several different patterns that develop in the relationship between price and the indicator. For this article, the discussion will be limited to the basic forms of divergence.
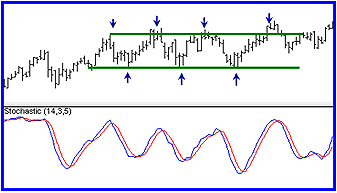
It is important to note that there must be price swings of sufficient strength to make momentum analysis valid. Therefore, momentum is useful in active trends, but it is not useful in range conditions in which price swings are limited and variable, as shown in Figure 4.
|
Figure 4: In range conditions the indicator does not add to what we see from price alone. Variable pivot highs and lows show range. |
Source: TDAmeritrade Strategy Desk |
Divergence in an uptrend occurs when price makes a higher high, but the indicator does not make a higher high. In a downtrend, divergence occurs when price makes a lower low, but the indicator does not make a lower low. When divergence is spotted, there is a higher probability of a price retracement. Figure 5 is an example of divergence and not a reversal, but a change of trend direction to sideways.
|
Figure 5: Momentum divergence and a pullback. Higher pivot highs (small orange arrows) signal price support. |
Source: TDAmeritrade Strategy Desk |
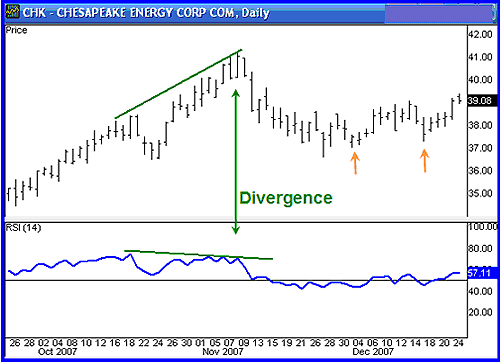
Divergence helps the trader recognize and react appropriately to a change in price action. It tells us something is changing and that the trader must make a decision about the trade, such as tighten the stop-loss or take profit. Seeing divergence increases profitability by alerting the trader to protect profits.
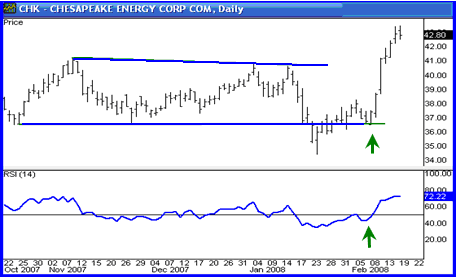
Take note of the stock from Figure 5, Chesapeake Energy Corp. (NYSE:CHK), in which shares pulled back to the support. The chart of CHK in Figure 6 (below) shows that trends do not reverse quickly or often. Therefore, we make the best profits when we understand trend momentum and use it for the right strategy at the right time.
|
Figure 6: Trend continuation. Agreement between price and the indicator give an entry (small green arrows). |
Source: TDAmeritrade Strategy Desk |
Managing Divergence
Divergence is important for trade management. In Figure 5, taking profit or selling a call option were fine strategies. The divergence between the price and the indicator lead to a pullback and then the trend continued. If you look at the pivot the price makes below the lower trendline, this is often referred to as a bear trap, where the false signal draws in shorts and then price quickly reverses. We can see that the signal to enter appeared when the higher low in price agreed with the higher low of the indicator in Figure 6 (small green arrows).
Divergence indicates that something is changing, but it does not mean the trend will reverse. It signals that the trader must consider strategy options: holding, selling a covered call, tightening the stop, or taking partial profits. The glamour of wanting to pick the top or bottom is more about ego than profits. To be consistently profitable is to pick the right strategy for what price is doing, not what we think price will do.
|
Figure 7: Divergence results in range. |
Source: TDAmeritrade Strategy Desk |
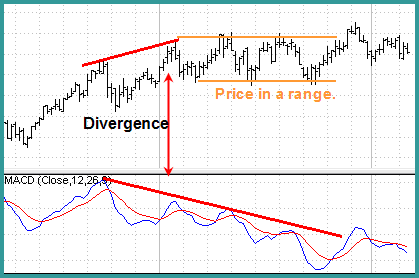
Figure 7 shows divergence that leads to sideways price action. Notice the weakening momentum in moving average convergence divergence (MACD) as price enters a range. This signals that the trader should consider strategy options. When price and the indicator are inconsistent relative to each other, we have disagreement, or divergence. We are not in control of what price will do; we control only our own actions.
|
Figure 8: Divergence and then reversal of trend. |
Source: TDAmeritrade Strategy Desk |
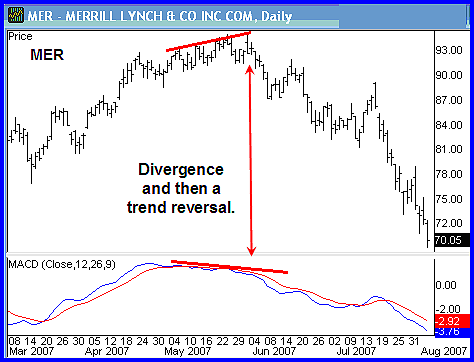
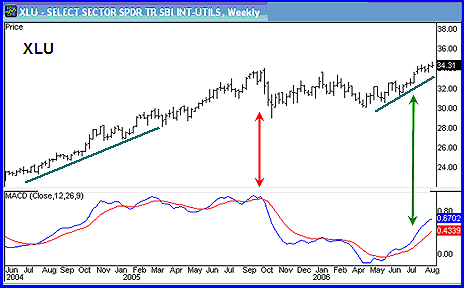
Sometimes divergence will lead to a trend reversal, as shown in Figure 8. The Utilities Select Sector ETF (AMEX:XLU) shown in Figure 9 pays a dividend and has options. Understanding trend momentum gives a profit edge as there are three ways to profit here: capital gains, dividends and call premium. This example shows trend continuation after a sideways move, which translates into profit continuation.
|
Figure 9: Go with the trend when the price and the indicator agree. |
Source: TDAmeritrade Strategy Desk |
Conclusion
The most useful way to use a momentum indicator is to know what strategy to use. Price will lead the way but momentum can indicate a time to preserve profits. The skill of a professional trader lies in his or her ability to implement the correct strategy for price action. Article by Candy Schaap
HUD (Heads Up Display)
With all of our Intentional Indicators our attempt is to remove all extraneous information, and to put the information that we really need for making trade decisions right in front of us on our charts. This is the “HUD” or “Heads Up Display” approach we take with each of our indicators. This approach to developing our indicators creates much cleaner, neater charts and keeps the trader from having to look away from his or her target to make a good trade decision. It simplifies every trade decision so that they can be made quickly and accurately.
For our purposes, we are simply looking for an indication that price is showing a potential reversal per an underlying set of data. It is not important to watch this data to determine if a condition does or does not exist. We simply need to keep our eyes on our charts and only the necessary information will be used to alert us to the fact that a condition exists. Therefore, the need for multiple charts, monitors, computers, and indicators is greatly diminished.
SuperD
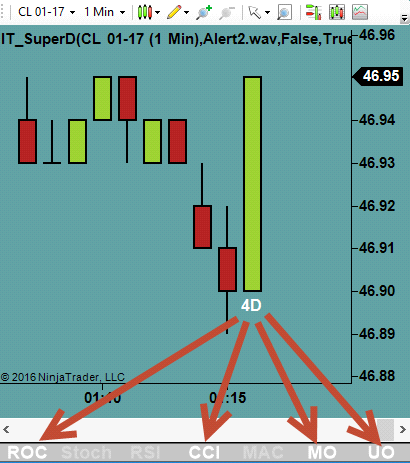
The SuperD indicator combines 7 different momentum oscillators from which it develops divergence signals. These indicators are:
- ROC or Rate Of Change
- Stoch or Stochastics
- RSI or Relative Strength Index
- CCI or Commodity Channel Index
- MACD or Moving Average Convergence/Divergence
- MO or Momentum Oscillator
- UO or Ultimate Oscillator
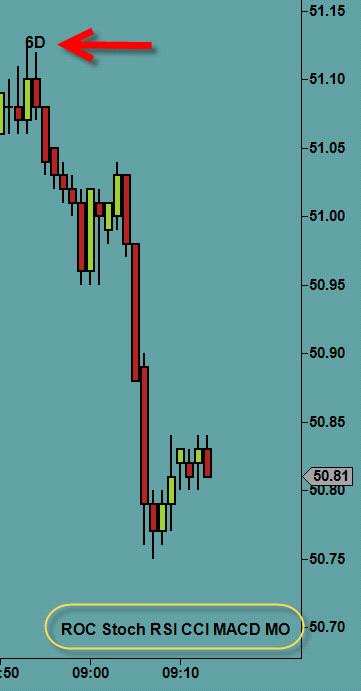
The SuperD indicator will generate a text object on a chart to indicate when divergence is present. This object will print on the open of the current bar only if the parameters that have been set indicate divergence, and will print either above or below the bar. If it prints above the bar, then a reversal or pullback sell (short) might be anticipated. If it prints below the bar, then a reversal or pullback buy (long) might be anticipated.
Parameter Settings
SuperD has several parameter settings to give the trader the ability to adjust or tune the indicator to whatever instrument, chart, or time frame that he or she desires.
Alert Parameters
- Audio Alerts On
- Audio Alert File Name
Enable Parameters
Enable or Disable individual momentum oscillators.
General Parameters
Period
The period used to compute the average price gains and losses
Smooth
The smoothing period used to smooth the resulting RSI values.
LookBack
The number of bars to look back at and measure when determining divergence.
PriceDiffLimit
The difference in price the bar must be when being compared with others to determine divergence.
ScanWidth
How far back to look for High or Low value of a bar
IndicatorDiffLimit
The difference in price that bar must be when comparing for divergence
Visual Settings
Layout
Place status bar on Top, Bottom, Left, or Right of the chart. Can also disable the status bar here.
The status bar indicates which Momentum Oscillators that price has diverged from. They are indicated in the colors chosen in the Text font colors.
Text Font
Select the “+” to expand the font parameter selections.
Up and Down Color
Change the color of the font on the chart. This will also be the font color in the status bar.


Chart Signal Vertical Displacement
Number of pixels to displace chart signals from above or below the bar. Example on left has setting of 1. Example on right has setting of 15.
Remove Chart Signal after X Bars
Will remove previous signals from the chart after a user defined number of bars.
Calculate on bar close
When true, indicator values are calculated at the close of a bar, else on each incoming tick.
Persistence
Each of our HUD indicators comes with the ability to save the parameters into separate templates for different applications. For example, if a trader chose to use the indicator on a 1 minutes CL chart and a 5 minute GC chart, the parameters are likely to have different settings to optimize the performance on each data series and instrument. NinjaTrader has the ability to save a template of the default setting for an indicator, but not to save the settings as applied to different instruments, data series, or chart types.
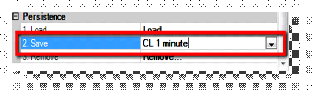
Persistence allows the trader to Load a template, Save a template, or Delete a template.
To save a template once the indicator parameters are set up as required, click inside the box labeled “Save…”. If this template has been saved before to a name that you would like to save it to again, click on the down arrow and select the name of the template you would like to over write with the new parameters. If you would like to create a new name, highlight the “Save…” and delete it. Type in a new template name for the saved indicator parameters.
The next time the indicator is added to a chart, the default indicator parameters will be automatically applied. To change these default parameters, use your persistence template by clicking on “Load” and then select the down arrow to open the drop down box with a list of available, previously saved, templates.
To remove a saved template, click inside the remove box and select the drop down with the list of previously saved templates. Select the template you wish to remove. Be very careful to select the template to be removed as you will not get a message asking you if you are sure this is what you want to do. Any template selected will immediately be removed.
Note: There are no perfect settings for this indicator. The more draw objects you require at the highs and lows of a historical chart, the more you will get inside a trend. This indicator only reports with a condition, or set of conditions, currently exist in the market. This is typical of any indicator and is only to be used as a tool to help determine a potential pullback. Do not use this or any other single indicator as an entry or exit signal. This indicator is a tool to help the trader read the current conditions only. It is up to the trader to use his or her own discretion when making trade entry or exit decisions.