OBOS (Overbought/Oversold) indicator
Overbought refers to a situation in which the demand for a certain asset or security unjustifiably pushes the price of that asset or underlying asset to levels that are not justified by fundamentals. Overbought is often a term used in technical analysis to describe a situation in which the price of a security has risen to such a degree - usually on high volume - that an oscillator has reached its upper bounds.
An asset being overbought can be explained by an almost constant upward trend in the price of an asset that exhausts all the buyers for the asset. As a result, the asset becomes vulnerable to a price reversal because all those who wanted to buy it likely already have it and supply forces may start to outweigh demand forces leading to selling pressure on the asset. On the fundamental level, an asset may be overbought if demand for it has made its future cash flows discounted back to the present not justify the asset's current price.
When an oscillator reaches its upper bound, it is generally interpreted as a sign that the price of the asset is becoming overvalued and may experience a pullback. An asset that has experienced sharp upward movements over a very short period of time is often deemed to be overbought. Determining the degree to which an asset is overbought is very subjective and can differ between traders. Technicians, practitioners of technical analysis, use indicators such as the relative strength index (RSI), the stochastic oscillator or the money flow index to identify securities that are becoming overbought. An overbought security is the opposite of one that is oversold.
The RSI compares prior trading periods average gains versus average losses. Like other statistical measures, as the number of periods used in the calculation increases - the more accurate the RSI measure becomes. An RSI value of 80 or above indicates that an asset is overbought, showing that the asset in question has sustained higher and higher prices for a long period of time. Contrarily, an RSI value of 30 or below indicates that an asset is oversold.
The stochastic oscillator compares the current price of an asset to its price range in prior trading periods. When an asset frequently closes near its highs, it is considered to be in an uptrend; when it frequently closes near its lows, it is considered to be in a downtrend. If the assets price starts closing away from either its highs or lows, it is considered a weakening of either an up or down trend. Like RSI, a stochastic oscillator value of 80 or above indicates that an asset is overbought, while levels of 20 or lower indicate that an asset is oversold. The money flow index also evaluates whether an asset is overbought or oversold by analyzing the selling or buying pressure on the asset; it does this by considering the price volatility of and volume of trading in the asset.
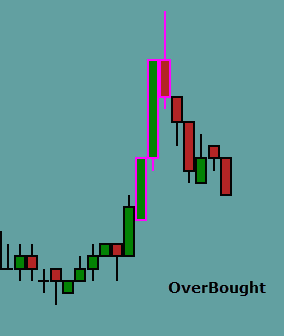
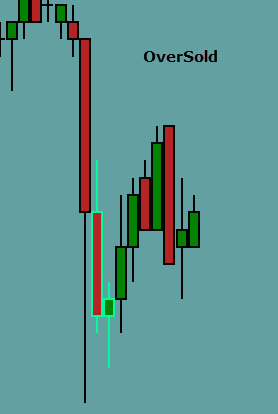
In the past, determining an overbought or oversold condition in an asset required placing a momentum oscillator along the bottom of a chart. This indicator can be very useful, but take up a lot of chart real estate. The OBOS indicator removes the huge space wasting indicators (typically displayed in a lower subpanel), and put the output from those indicators directly on the price bars. We no longer need to look away from the price action to see if we have reached an oversold or overbought condition (which points to a potential reversal or pullback). This is a crucial element of our pullback trade setups.
The OBOS Heads Up Indicator Settings
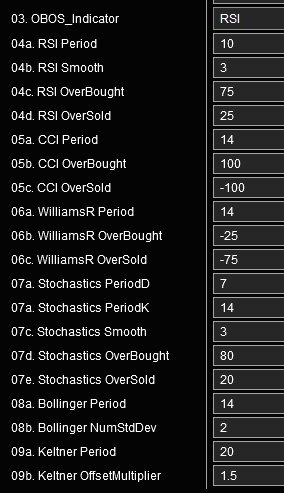
Parameters: Choice of Oscillator
The oversold or overbought condition can be determined by selecting any one of the following indicators:
- Bollinger Bands
- CCI
- RSI
- Keltner channel
- Stochastics
- Williams R
Each indicator has user selectable settings to customize it to give the trader the exact information he or she requires.
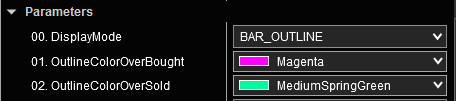
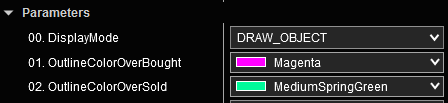
Parameters: DisplayMode
There are three display modes in which the OBOS indicator will identify an oversold or overbought condition:
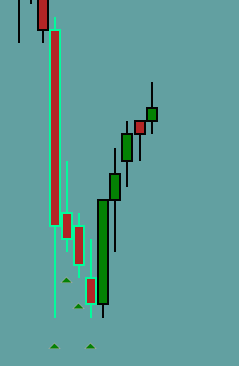
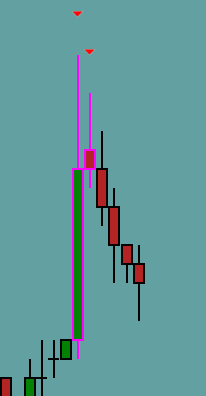
- Display Bar Outline: This setting will paint the outline of a candle in a user-defined color.
- Display Draw Objects Only: Use this setting to display OBOS conditions when a chart already has an indicator in use that outlines a candle or colors a HiLo or OHLC bar.
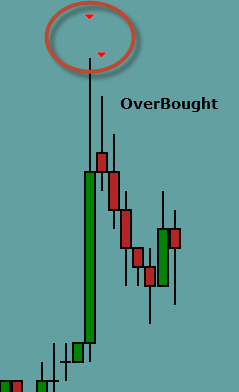
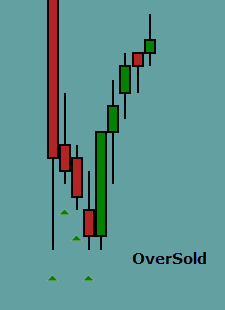
To adjust the distance of the draw object from the price bar simply change the PriceDisplacement value.
The default symbols are red and green triangles. To change to a different symbol, please see discussion under “BarDrawObject” below.
3) Display Both Bar Outline and Draw Objects:
It is possible to display both bar color and draw objects on Candle, HiLo and OHCL bar types at the same time.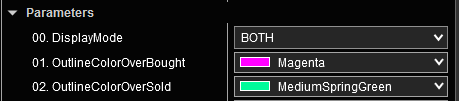
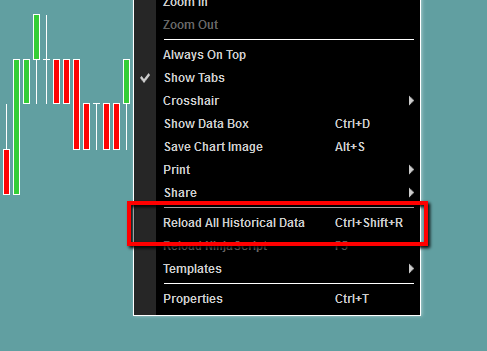 NOTE: If the Chart Type in the Data Series is changed from Candle bars to either HiLo or OHLC bars; or from HiLo or OHLC bars to Candle bars, then it may be necessary to reload all historical data in order for the chosen bar type to display correctly. To do this, right click the chart when connected to a data feed and select “Reload All Historical Data” as shown here:
Data
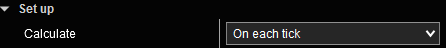
Calculate determines when to check to see when the bar becomes over bought or over sold. "On each tick" puts slightly more load on your computer during start up, but has negligible effect during normal trading.
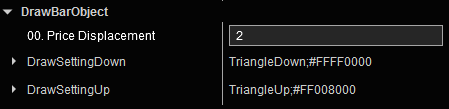
DrawBarObject
In the DrawBarObject area, the user can do the following: change the symbol that displays above and below the OBOS bar; choose how far the symbol prints from the bar (along the price axis); and select a sound file if an audio alert is desired.
PriceDisplacement and SoundLocation settings with an optional sound alert file can be applied when the condition is positive.
Adjust the distance of the OBOS symbol from the price bar by using the PriceDisplacement setting.
DrawSettingDown and DrawSettingUp: users can change the default red and green triangles to any symbol that is available in their character sets.
Steps required to change to a custom printed character:
For illustration, let’s say the user prefers a star rather than a triangle. How do we display a star on the chart? Follow the steps below:
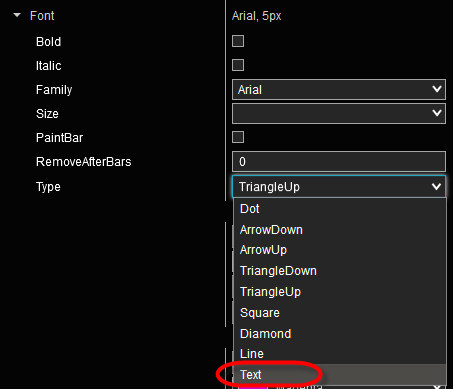
- To change to a new custom symbol, select “Text” in the OBOS indicator settings under DrawBarObject.
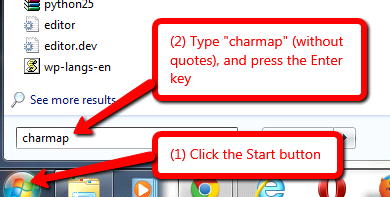
- To view and choose a character set, click on the Windows Start button. Type charmap and press Enter.
- This last step will bring up all the character sets available on the local computer. Browse through the options such as Webdings, Wingdings, or other graphical or text characters.
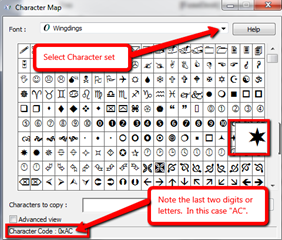
- For example, let’s say the user wants a star from the Wingdings set. Make a note of two pieces of information: (1) that it is in the Wingdings set; and (2) that the character code ends in “AC”.
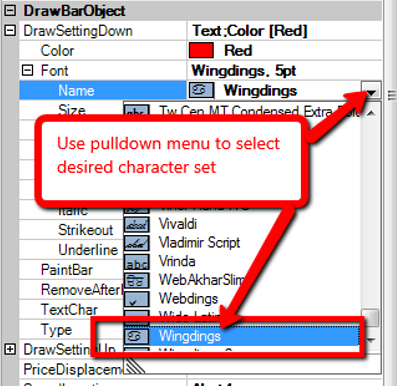
- Next, go back to the OBOS indicator settings in NinjaTrader. Under Font Name, use the pulldown menu to select the character set from Step 4. For our example, we select “Wingdings.”
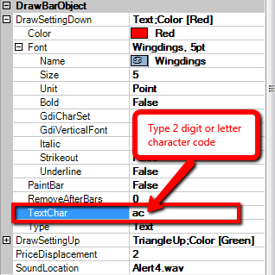
- From Step 4 above, type in the two digit or letter character code for the particular character that was chosen from the character set. This is entered in the OBOS indicator settings under the TextChar settings as shown to the right.
In this example, we would type ac (not case sensitive) in the TextChar box in order to get the Wingdings star.
From here, the user can select the size and color of the chosen symbol.