Mometer
Because trends are composed of a series of price pullbacks and retracements, momentum plays a key role is assessing trend strength and potential weakness. As such, it is important to know when a trend is likely to be becoming exhausted. Strong momentum does not always lead to exhaustion and a reversal, but it does signal that something will most likely be changing soon, and that the trend may consolidate or retrace. After all, trends must stop at some point and retrace or pullback. All trends do it, and they always will.
Price momentum refers to the direction and magnitude of price movement. Measuring momentum gives traders insight on where and when price is most likely to slow or stop and pullback. The Mometer will help you to evaluate price momentum and show you what exhaustion is likely to do to the near term direction of a trend.
Defining Price Momentum
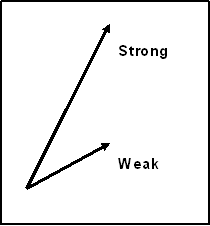
The magnitude of price momentum is measured by the length of short-term price moves. The beginning and end of each move is established by price pivots or anchor points. Strong momentum is exhibited by a steep slope and a long price move. Weak momentum is seen with a shallow slope and short price swing (Figure 1).
|
Figure 1: Momentum |
For example, the length of the up moves in an uptrend can be measured. Longer up moves suggest that the uptrend is showing increased momentum, or getting stronger. Shorter up moves signify weak momentum or price drift. Equal length up moves means the momentum is consistent, but not strong nor weak.
For our purposes, we are simply looking for an indication that price is showing strong momentum according to an underlying set of data. It is not important to watch this data in order to determine if this condition does or does not exist. We simply need to keep our eyes on our charts and only the necessary information will be used to alert us to the fact that the condition exists. Therefore the need for multiple charts, monitors, computers, and indicators is greatly diminished.
Mometer Description
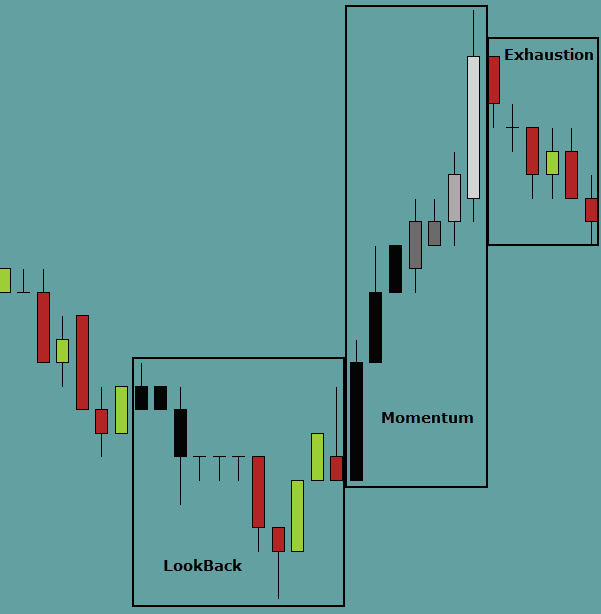
The Mometer indicator allows for the user to define threshold levels for acceptable momentum signals. The indicator reads the bar sizes (Hi to low, in ticks/pips) of each of the bars in the number of bars in the lookback period and averages them. The current bar is then compared to this average and if it exceeds this average by a user definable percentage, this bar becomes a potential anchor bar to begin a series of bars that could indicate increasing momentum. Each subsequent bar is then measured relative to the previous bar to determine if that bar is showing steady or increasing momentum.
There are times in a momentum series when a small body bar in the opposite direction of the momentum is displayed. If the user would like to filter these small bodied bars, a parameter setting is available for the size body to filter by percentage of the previous bar size. This will remove the bar from consideration in the momentum series and the series will continue until a larger bar in the opposite direction that exceeds the filter is displayed. This opposite direction bar will signal the end of the current momentum series. However, depending on the parameter settings, this bar could also be the beginning of a new momentum series in the opposite direction.
The first bar of a momentum series will not necessarily be the first bar in that direction of the series. In fact, it is common for momentum to increase more slowly and build. Momentum may only be evident after several bars in a particular direction. When this is the case, the Mometer indicator will back paint all of the bars that preceded the anchor bar but were in the proper direction. This is done simply to help the user identify that these slow momentum bars where part of the series even though it was not evident until later. This gives the user a better sense of the actual momentum and better information for making quick decisions.
Figure 1
Indicator Settings
Parameters
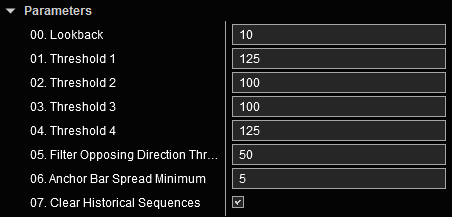
Figure 2
00. Lookback: The number of previous bars to combine and average to determine if the current bar qualifies as an anchor bar for a momentum series.
01. Threshold 1: The current bar must be this % or more of the size of the average of the lookback bars to generate an anchor bar.
02. – 04.: Threshold 2-4: The current bar must be this % or more of the size of the previous bar to generate a signal.
05: Filter Opposing Direction Threshold: If the current bar closes in the opposite direction of the bars in the momentum series, it must be this % or less of the size of the previous bar to keep from canceling the momentum series.
06. Anchor Bar Spread Minimum: Minimum number of tick size to qualify as an anchor bar to start a series of momentum.
07. Clear Historical Sequences: Leave all historical momentum series on the chart or only the current series is displayed.

Using the colors selected for Thresholds 00 - 04 (Figure 3 at left) the user would expect to see black bars at the beginning of a momentum series. As the momentum increases throughout the series, the bars would become lighter shades of gray. The lighter the shade of gray, the more likely momentum is going to start showing signs of exhaustion and thus a retracement or pullback is more likely. (see Figure 1)