First Touch Reset (FTreset)
The First Touch indicator (“FT Reset”) is based on a simple concept known as “Pivot Point Trading” that many professionals respect, however, that many retail traders tend to dismiss and discount its true potential. (The name FTreset came from a trade setup that we have traded in The Intentional Trader trading room for many years. FT = First touch of a major support/resistance line, reset=the relative strength of the support/resistance resets to 0 when touched)
As the world knows today, financial institutions such as investment banks and hedge funds are some of the most important forces in almost all financial markets. They either execute large orders for their clients or for themselves (in essence, proprietary trading). Thus it makes intuitive sense for traders to follow the “smart money” instead of defying it, because after all we imagine that the Wall Street gurus (colloquially known as the “Big Boys”) know what they are doing! However, how do we follow them? How do we know what they are up to? How do we know we’re not following dumb money instead of smart money? Many snake-oil vendors may claim to know this insider information, but one must think to basic principles of economics – supply and demand.
Over the years of trading, many professional traders/floor traders have observed market activity and witnessed a great phenomenon, traders actually tend to “halt” at levels and at these certain levels in the market, major buying pressure or selling pressure arises lasting from a few seconds to a few hours. After witnessing these levels of temporary indecision and consequential increased buying or selling pressure, traders have deduced that the big boys tend to place their orders at these specific levels for their clients or otherwise. Why, one may ask, can’t they just sell at any price they want? The answer is simply derived from supply and demand, how much should a security be worth at that specific time. If the stock is undervalued greatly or an overreaction to a news item or some other fundamental has occurred, then traders will tend to purchase at these levels rather than sell at these levels. For instance, if bananas were valued at $6/kg then suddenly dropped to $3/kg, many people would rush to get the bargain price and this will re-establish the price back to $6/kg; the same logic applies to financial markets. Smart money buys the security when it’s deemed to be technically undervalued and sell when it’s deemed to be overvalued. These special levels are universally called "support and resitance" and have been widely employed worldwide.
An example of support and resistance lines is exhibited below:
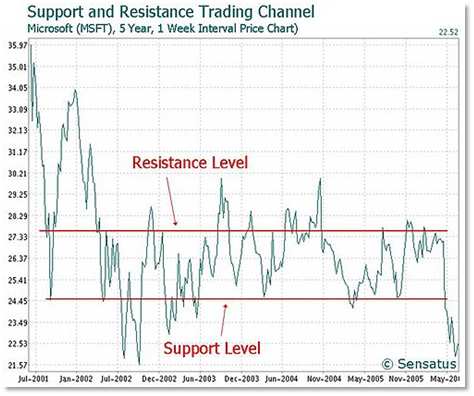
As we can see above, at $24.45 buyers can precedent over sellers as they believe for the time being, MSFT stock is undervalued and needs to be corrected back its original level, this is the support level. However, at approximately $27.35 sellers take precedent over buyers as they believe that MSFT is overvalued and thus sell in order for MSFT to reach its fair value.Over time (although an extremely old trading principle), traders began to realize this unique pattern and noticed that multiple zones of excessive demand or supply can be mathematically modeled to an elegant equation:
Support = 2 x Pivot Point – High of the previous Day
Resistance = 2 x Pivot Point – Low of the previous Day
A Pivot Point is similar to support and resistance, however it acts as more of a reference measure than an actual buying or selling pressure zone. The pivot point is an average of the High, Low and Close of the previous day (H+L+C/3) which signifies the “average” expected price of future sessions. Therefore, if the actual price is greater than the pivot point level it can be evaluated as bullish sentiment and vice versa.
As there are multiple levels of support and resistance, traders determined that future support and resistances (commonly called in short form: S1, S2, S3 and R1, R2, R3) are significantly stronger levels of demand and supply. This is because if the 1st levels of zones are not supported by traders, then the 2nd level of them must be supported as it is further under or overvalued.
An example is illustrated below:
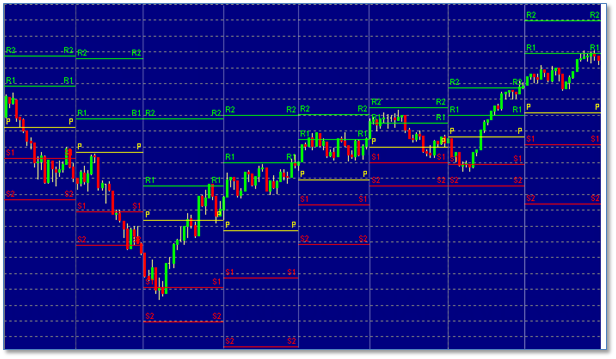
This chart has plotted the Pivot Point zone and the support and resistance zones up to 3 levels deep. It can be seen that the levels are respected and if not, deeper levels gradually obtain greater respect over time.2
Further support and resistances can be calculated by the following formula:
R2 = Pivot Point + (High− Low)
S2 = Pivot Point − (High − Low)
And:
R3 = High + 2×(Pivot Point − Low)
S3 = Low − 2×(High – Pivot Point)
Since the market is dynamic and moves in real-time, any time frame can be used for support and resistance. Even though it is optimized for intraday trading, the formula can be easily adjusted to meet the needs of swing traders to capture the bigger picture moves on support & resistance.
By fully understanding the concept of support and resistance, a trader can adjust their system to capture better buying and selling pressure by adding technical indicators and price action knowledge to gage true buying or selling pressure.
FTreset indicator
There are a number of unique features to the FTreset into to make it stand out above other Support/Resistance indicators.
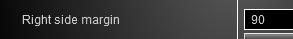
Each line has 2 numbers at the far right end of the line. If you do not see these numbers when you apply the indicator to a chart, you will need change the size of the right side margin of the chart.
Changing Right Side Margin
Right click anywhere on a trading chart and select "Properties" at the bottom of the list. Go to "Right side margin" and type in 90. You can adjust this later after you have had some experience working with the indicator.
Settings
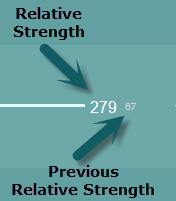 Labels are the numbers at the end of each line. These numbers are considered the "relative strength" of each line. The higher the number, the longer it has been since price has been at this level and the more a trader can expect to see price react to this level. Once the level has been touched by price, the number will reset to 0 and begin counting again. The number on the left will move to the right and become the "Previous" number.
"Previous Relative Strength" was the relative strength number before the count reset and began again. This is a valuable number in case the trader was not looking at the chart when price came up and hit the level which causes the Relative Strength number to reset to 0. If a trader still wants to make a decision based on the relative strength, then the number that just moved to the right might be helpful.
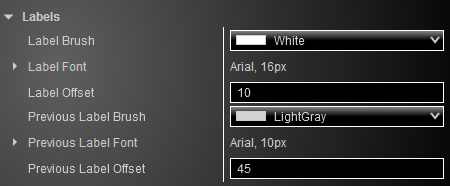
Label Brush = Color of the number
Label Font = Adjust size and style of the number font
Label Offset = distance from the end of the line to print the label
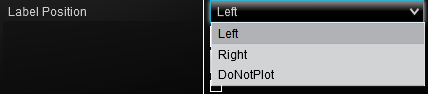
Label Position = Left end of line, Right end of line, or Do No Plot or show on the screen
Line Width = Number of bars wide (right to left) starting from the current bar.
Pivot Formula
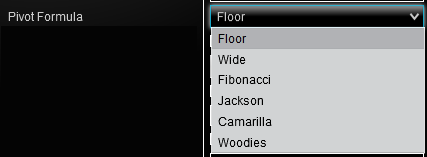
Select the formula to use to calculate the support/resistance pivot point. All other lines will be calculated from this pivot.
Round To Tick Size = Line will print on the closest tick to the calculated value.
Settlement/Close = Select which close price to use in the formula chosen to calculate the pivots
Show Midpivots = Turn on/off the midpoint lines between the standard support and resistance lines.
Zones
Each line can have a zone placed on each side of it to help traders anticipate a reaction. These zones allow for a larger support/resistance area where traders might begin to become reluctant to buy or sell.
Zone Opacity = The color transparency level
ZoneShowAll = Toggle zones on/off
ZoneSize = number of ticks on each side of the line
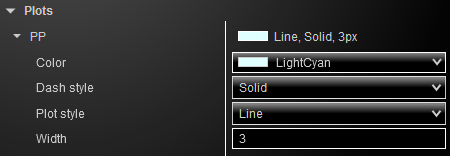
Plots
Each line can have its own color and style. These parameter are available under the Plots section.
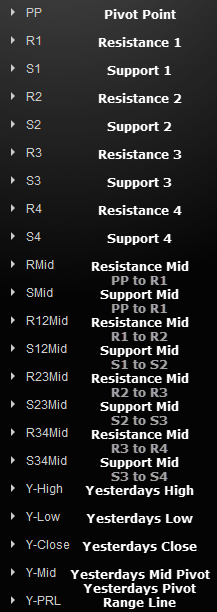
Pivot Line Definitions